The following is an example of retrieving modality-probe log data off an embedded device using the debug interface.
# Overview
Working on embedded systems often comes with a sizeable amount of effort dealing with I/O. Not only for the system at hand, but additionally for any extra debugging and introspection utilities: you have to get the data out one way or another.
In this blog post, we'll explore using modality-probe-debug-collector (opens new window) to help alleviate some of this pain by taking advantage of our device's debug interface for trace data exfiltration.
This means we don't need to bother wiring up an extra egress socket channel, UART, or other out-of-band comms machinery.
We'll start off by instrumenting the ip example (opens new window)
from stm32-eth (opens new window),
a Rust Ethernet driver crate for stm32 microcontrollers.
The example sets up a basic interrupt-driven smoltcp (opens new window) TCP/IP stack and TCP socket.
After we do basic probe setup and instrumentation, we'll be able to more closely examine the system behavior using the causal event graph, state transition graph, and a trace log.
# Example project
As we stated, we'll be working off the ip example from stm32-eth.
Our device is a stm32f429 microcontroller on a
Nucleo F429ZI (opens new window) board.
If you're unfamiliar with any of the repository details, a good place to start is the cortex-m-quickstart (opens new window) Rust documentation.
We've already gone through the effort of getting the example put together in its own repository with all the steps we're going to cover.
To get started, clone the example project repository:
git clone https://github.com/auxoncorp/modality-probe-debug-collector-example.git
modality-probe-debug-collector-example/
Now install the Rust target for our Cortex-M4F:
rustup target add thumbv7em-none-eabihf
Finally, install openocd, which is the tool we'll use to flash the example image:
sudo apt install openocd
# Running CLI and codegen as a build step
The first thing we'll want to do is get a build script set up to invoke Modality probe CLI tooling. This will generate our Modality probe manifests and source code definitions ahead of the compilation step.
Since we're using Rust, we can leverage the CLI's library interface in a build script rather than invoking it as a binary on the system.
Tell cargo we're using a build script in the Cargo.toml:
build = "build.rs"
Then add the CLI as a build dependency:
[build-dependencies.modality-probe-cli]
git = "https://github.com/auxoncorp/modality-probe.git"
version = "0.3.0"
Next create a build.rs file to run the codegen invocations:
#![deny(warnings)]

use modality_probe_cli::{header_gen, lang::Lang, manifest_gen};

fn main() {
    // Generate a component named "example-component", in the directory
    // "example-component" based on searching through the source code in
    // "src/main.rs"
    let manifest_gen_opts = manifest_gen::ManifestGen {
        lang: Some(Lang::Rust),
        component_name: "example-component".into(),
        output_path: "example-component".into(),
        source_path: "src/main.rs".into(),
        ..Default::default()
    };
    manifest_gen::run(manifest_gen_opts, None);

    // Generate Rust definitions in "src/component_definitions.rs"
    // from the component directory "example-component"
    let header_gen_opts = header_gen::HeaderGen {
        lang: Lang::Rust,
        output_path: Some("src/component_definitions.rs".into()),
        component_path: "example-component".into(),
        ..Default::default()
    };
    header_gen::run(header_gen_opts, None);

    println!("cargo:rerun-if-changed=src/main.rs");
}
Now each time we do cargo build, Modality's CLI will automatically
update the component manifests and regenerate the source code definitions.
# Adding a probe
Once we've gotten the CLI tasks out of the way, we're ready to add a probe.
When using the debug-collector we need to consider how we're going to tell the collector where our probe lives in memory.
One of the easier ways to do this is to make our probe's backing storage
buffer global and decorate it with #[no_mangle].
This means we can use the symbol name directly in conjunction with our elf file.
Head over to src/main.rs and add:
/// Global and `no_mangle` so we can easily resolve the symbol
/// with modality-probe-debug-collector
#[no_mangle]
static mut PROBE_BUFFER: [MaybeUninit<u8>; 1024] = [MaybeUninit::new(0u8); 1024];
Now we'll be able to give the symbol name PROBE_BUFFER to the debug collector
and it will resolve its address for us.
Here's the initialization using the global storage buffer:
let probe = unsafe {
    initialize_at!(
        &mut PROBE_BUFFER,
        EXAMPLE_PROBE,
        NanosecondResolution::UNSPECIFIED,
        WallClockId::LOCAL_ONLY,
        RestartCounterProvider::NoRestartTracking,
        tags!("example", "ip"),
        "Example probe"
    )
}
.expect("Could not initialize probe");
# Instrumenting observability
The next thing we want to do is add events to the system.
We'll start in the main() loop, see src/main.rs for the complete source:
- TCP/IP stack initialization
record!( probe, IP_STACK_INITIALIZED, "TCP/IP stack initialized", tags!("ip") ); - TCP/IP stack state changes
record!( probe, IP_STACK_STATE_CHANGE, "IP stack had a state change", tags!("ip") ); - TCP socket listening, recording the port number as an event payload
record_w_u16!( probe, SOCKET_LISTENING, LISTEN_PORT, tags!("socket", "listen"), "Socket listening" ); - TCP socket sent a message
record!( probe, SENT_A_MESSAGE, "Sent a message", tags!("socket", "message") ); - Unknown/malformed packet received
record!(
    probe,
    MALFORMED_PACKET,
    "Received a malformed or unknown packet",
    tags!("ip")
);
# Build and run the example
We're ready to build and run the example now.
As we showed earlier, our build.rs script will automatically generate
our component manifest and Rust definitions.
You can take a look in ./example-component and src/component_definitions.rs to
see the generated content.
Using the normal cargo workflow, build the example:
cargo build
You can find the resulting elf file in target/thumbv7em-none-eabihf/debug/example-project.
Plug in your device via the USB connection and upload the image using
openocd, for convenience you can run ./flash.sh, which
runs this command:
openocd \
    -f openocd.cfg \
    -c init \
    -c "reset halt" \
    -c "flash write_image erase target/thumbv7em-none-eabihf/debug/example-project" \
    -c "reset run" \
    -c "shutdown"
The example is hard-coded to use the IP address 192.168.200.100, you
should be able to ping the device now:
ping 192.168.200.100
PING 192.168.200.100 (192.168.200.100) 56(84) bytes of data.
64 bytes from 192.168.200.100: icmp_seq=1 ttl=64 time=4.51 ms
64 bytes from 192.168.200.100: icmp_seq=2 ttl=64 time=4.47 ms
64 bytes from 192.168.200.100: icmp_seq=3 ttl=64 time=4.42 ms
You should also be able to connect to the TCP socket on port 80:
netcat 192.168.200.100 80
hello
# Getting the trace data
Now we're ready to start collecting trace logs. Our Nucleo board comes with an integrated ST-LINK debugger/programmer, we'll be using it to pull the log data off the device.
For convenience you can run ./collect_log_data.sh, which runs this command:
modality-probe-debug-collector \
    --attach stm32 \
    --elf target/thumbv7em-none-eabihf/debug/example-project \
    --reset 100ms \
    --interval 100ms \
    --output trace_log.jsonl \
    PROBE_BUFFER
The debug-collector will resolve the address of our probe symbol PROBE_BUFFER
from the elf file we built, collecting reports every 100 milliseconds after
performing a reset and initial delay of 100 milliseconds. The log data will
be written to the trace_log.jsonl file.
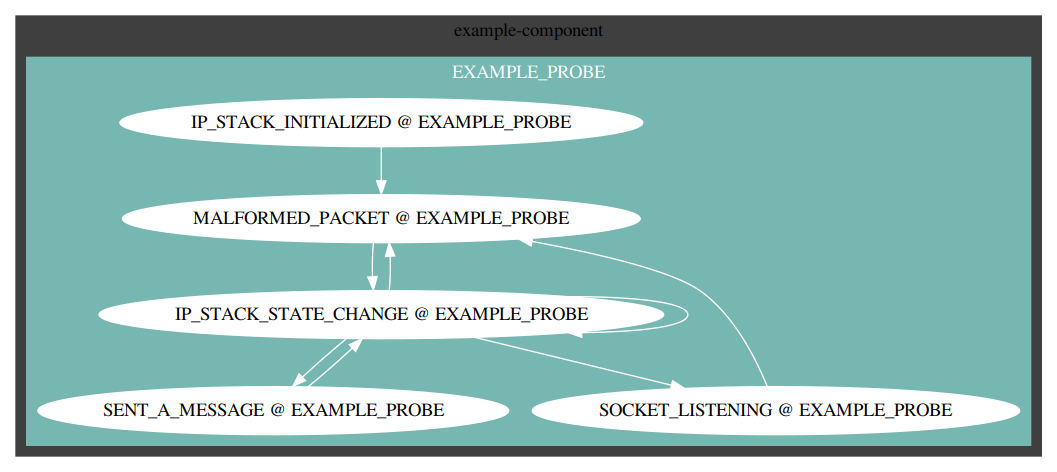
# Visualizing the causal history graph
Once we've collected some trace data, we can now visualize a dot graph.
For convenience you can run visualize_graphs.sh, which runs these commands:
modality-probe \
    visualize \
    cyclic \
    --component-path example-component \
    --report trace_log.jsonl \
    > cyclic_graph.dot

modality-probe \
    visualize \
    acyclic \
    --component-path example-component \
    --report trace_log.jsonl \
    > acyclic_graph.dot
To view the graphs, either convert to png (or any other preferred format using dot):
dot -Tpng cyclic_graph.dot > cyclic_graph.png
dot -Tpng acyclic_graph.dot > acyclic_graph.png
If you are running on Linux with x11, you can also open up an interactive display with:
dot -Tx11 cyclic_graph.dot
dot -Tx11 acyclic_graph.dot
# Inspecting the trace log
We can also inspect the trace log from our terminal using the log subcommand.
Running this command (or trace_log.sh for convenience) will produce a terminal log graph:
modality-probe \
    log \
    --graph \
    --component-path example-component \
    --report trace_log.jsonl

# Summary
We've shown how instrumenting modality-probe (opens new window)'s causal event tracing into an embedded application can provide meaningful insight into the operational behavior of the system through a simple example. Using tools like our modality-probe-debug-collector (opens new window) can make the experience all the better. If you found this post helpful, please share with others who can put it to use!