I'm pleased to announce the availability of the ROS2 probe for Modality. This integration brings the power of Modality to the Robot Operating System v2 (ROS2) ecosystem. It gives you completely automatic telemetry support for ROS2-based systems, including tracking source and receive events for every message, in addition to similarly precise tracking for service calls (RPC) on both the client and service side.
This currently supports ROS2 Humble with FastDDS (FastRTPS), on Ubuntu Jammy (22.04) amd64; other variants are doable, just let us know if you need something different.
# TL;DR
If you just want the goods, here they are: (But for the full demo, keep reading!)
- Binaries: https://github.com/auxoncorp/modality-ros2/releases/tag/v0.9.0 (opens new window)
- ROS2 Probe Docs: https://github.com/auxoncorp/modality-ros2 (opens new window)
export LD_PRELOAD=/path/to/so/file:/opt/ros/humble/lib/librmw_fastrtps_cpp.so
- Modality docs: https://docs.auxon.io/modality/ (opens new window)
- Conform docs: https://docs.auxon.io/conform/ (opens new window)
- Get the Modality, Conform, and a license: https://auxon.io/download (opens new window)
# What's Modality?
Modality is a specialized database for storing and querying detailed information about the run-time activity of cyber-physical systems. In ROS2 terms, it's like the data you get in a ROS bag, but with higher fidelity in the areas involved with node-to-node interactions.
Modality is not a system for playing back full sensors recordings and point clouds. In fact, you really shouldn't store those here. Instead it gives you a way to analyze your system's behavior, to understand how the different parts work together. Modality helps you analyze what your system is doing, not what it's seeing.
Once you've collected system traces in Modality, you can use Conform to check that they conform (heh) to some specifications that you've written. There's a lot more to say about Modality (opens new window), but we'll leave it there for now.
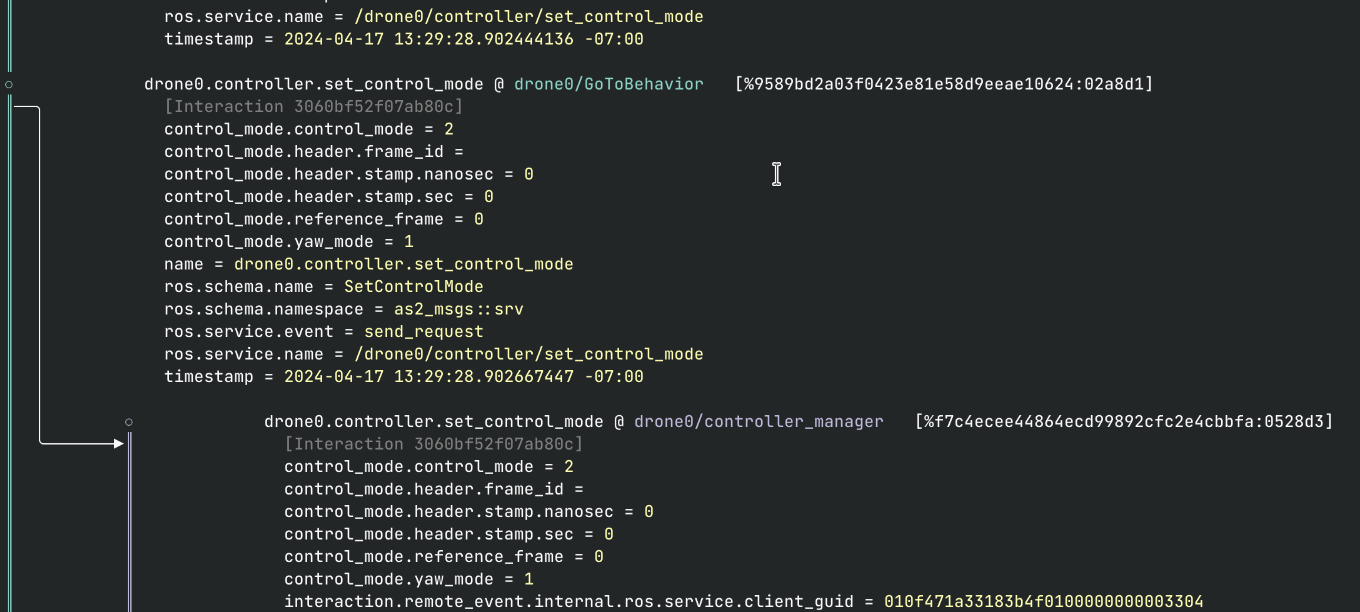 Precise Causal Connection between nodes in a ROS2 System Trace
# Instrumenting Your Robot
We're using the Aerostack2 (opens new window) drone autopilot as a demonstration here. It's a good target because it's a real system built using ROS2, but it also runs very well in simulation. It's also pretty easy to run the whole stack in Docker, which is great for our little example here.
# Running in Simulation
Let's start by getting the stack up and running without our probe. Aerostack2 is all set up to run in Ignition Gazebo; we'll be using their 'project gazebo' setup to get an empty simulation world that a few drones can fly around in.
# 0. Dependencies
This is set up to run on a Linux host system, inside of Docker (or Podman, in my case). We'll be running the simulator inside the docker container, so getting 3d acceleration working is important. The scripts below were set up for a pretty generic system (AMD graphics on Debian Bookworm), but you may need to adjust them to suit your distro or hardware, especially if you have NVIDIA graphics.
# 1. Clone the demo repo
git clone https://github.com/auxoncorp/aerostack2-with-modality --recurse-submodules
cd aerostack2-with-modality
This repo has a Dockerfile all set up to run Aerostack2 in simulation. It also submodules the 'project_gazebo' repo, which contains the simulation world and some configuration files.
(Actually, it's a fork of that repo; we updated it to automatically end the simulation after 2 minutes, for better repeatability of various test scenarios.)
# 2. Build and run the simulation
./run.sh
This runs docker build, tags the image as aerostack2-modality, and
then uses the appropriate docker incantation to run the image with UI
sharing and 3d graphics enabled.
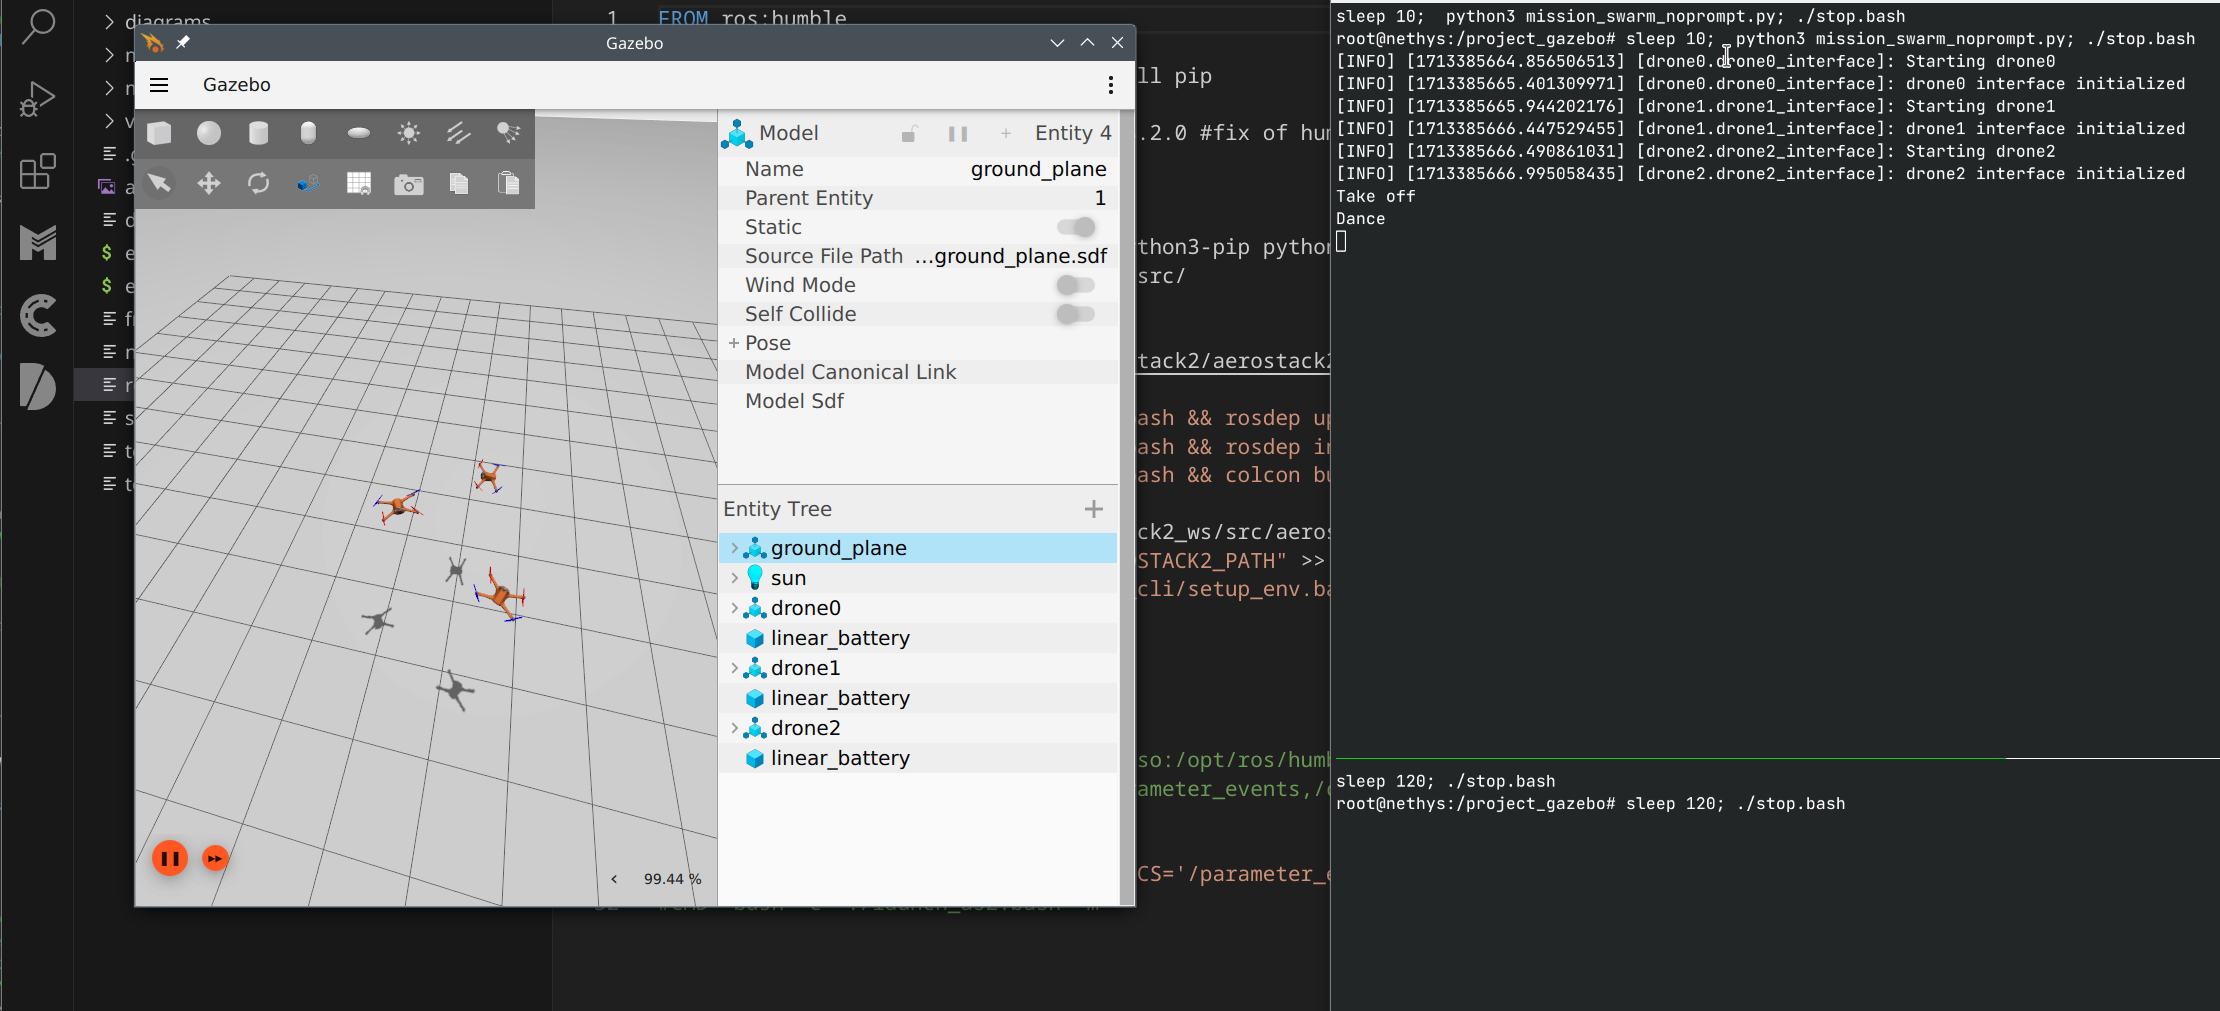 Aerostack2 Running in the Gazebo Ignition simulator
# Instrumentation
Now lets drop in the ROS2 Modality probe. First, make sure you have
Modality installed and accessible. If this is your first time using
Modality, you'll want to create a default user and token using
modality user create. Once you can get some output from modality user inspect, you should be good to go.
> modality user create russ
Created user 'russ' as the default user.

> modality user inspect
User: russ
    allow-http-api=true
    allow-ingest=true
    allow-mutation=true
    allow-manage-users=true

Token id: 1
    Inherit capabilities from user
Make sure you have a token with allow-ingest capabilities, as that's
what the probe library will need in order to make a data-ingest
connection back to Modality.
# 1. Download the probe
Get yourself the probe library from
https://github.com/auxoncorp/modality-ros2/releases/ (opens new window). Choose the
right one for your distro and architecture; in this case, the Docker
container is running Ubuntu 22.04 (Jammy), so we'll download
libmodality_ros_hook_22.04_amd64.so.
curl -LO https://github.com/auxoncorp/modality-ros2/releases/download/v0.9.0/libmodality_ros_hook_22.04_amd64.so
# 2. Modify the Dockerfile
The Modality ROS2 probe is written as an LD_PRELOAD library, which
observes node operations at the RMW (ROS Middleware) API boundary. To
use it in Docker, we need to copy it in and set the LD_PRELOAD
environment variable.
Add the following lines to the Dockerfile, replacing the CMD line at the bottom:
COPY libmodality_ros_hook_22.04_amd64.so /
CMD bash -c LD_PRELOAD=/libmodality_ros_hook_22.04_amd64.so:/opt/ros/humble/lib/librmw_fastrtps_cpp.so ./launch_as2.bash -m"
(If you're curious about why librmw_fastrtps_cpp is in there, see the 'How It Works' section below)
# 3. Wire up a bit of configuration
The probe takes its configuration from environment variables. First,
it needs to know how to connect to Modality. This defaults to
localhost; since we're running it locally, and have set the docker
container to use host-based-networking, the default is fine.
The probe also needs access to the authentication token, when it
connects to Modality. We already have one locally, so let's just map
it into the docker container in our .run.sh. Add this line to the
docker invocation, before the name of the docker image:
v ~/.config/modality_cli:/root/.config/modality_cli \
# 4. Run it!
./run.sh
The simulation will run for about two minutes. After that's done, you can use the Modality CLI or our VS Code extension (opens new window) to peruse the data you collected.
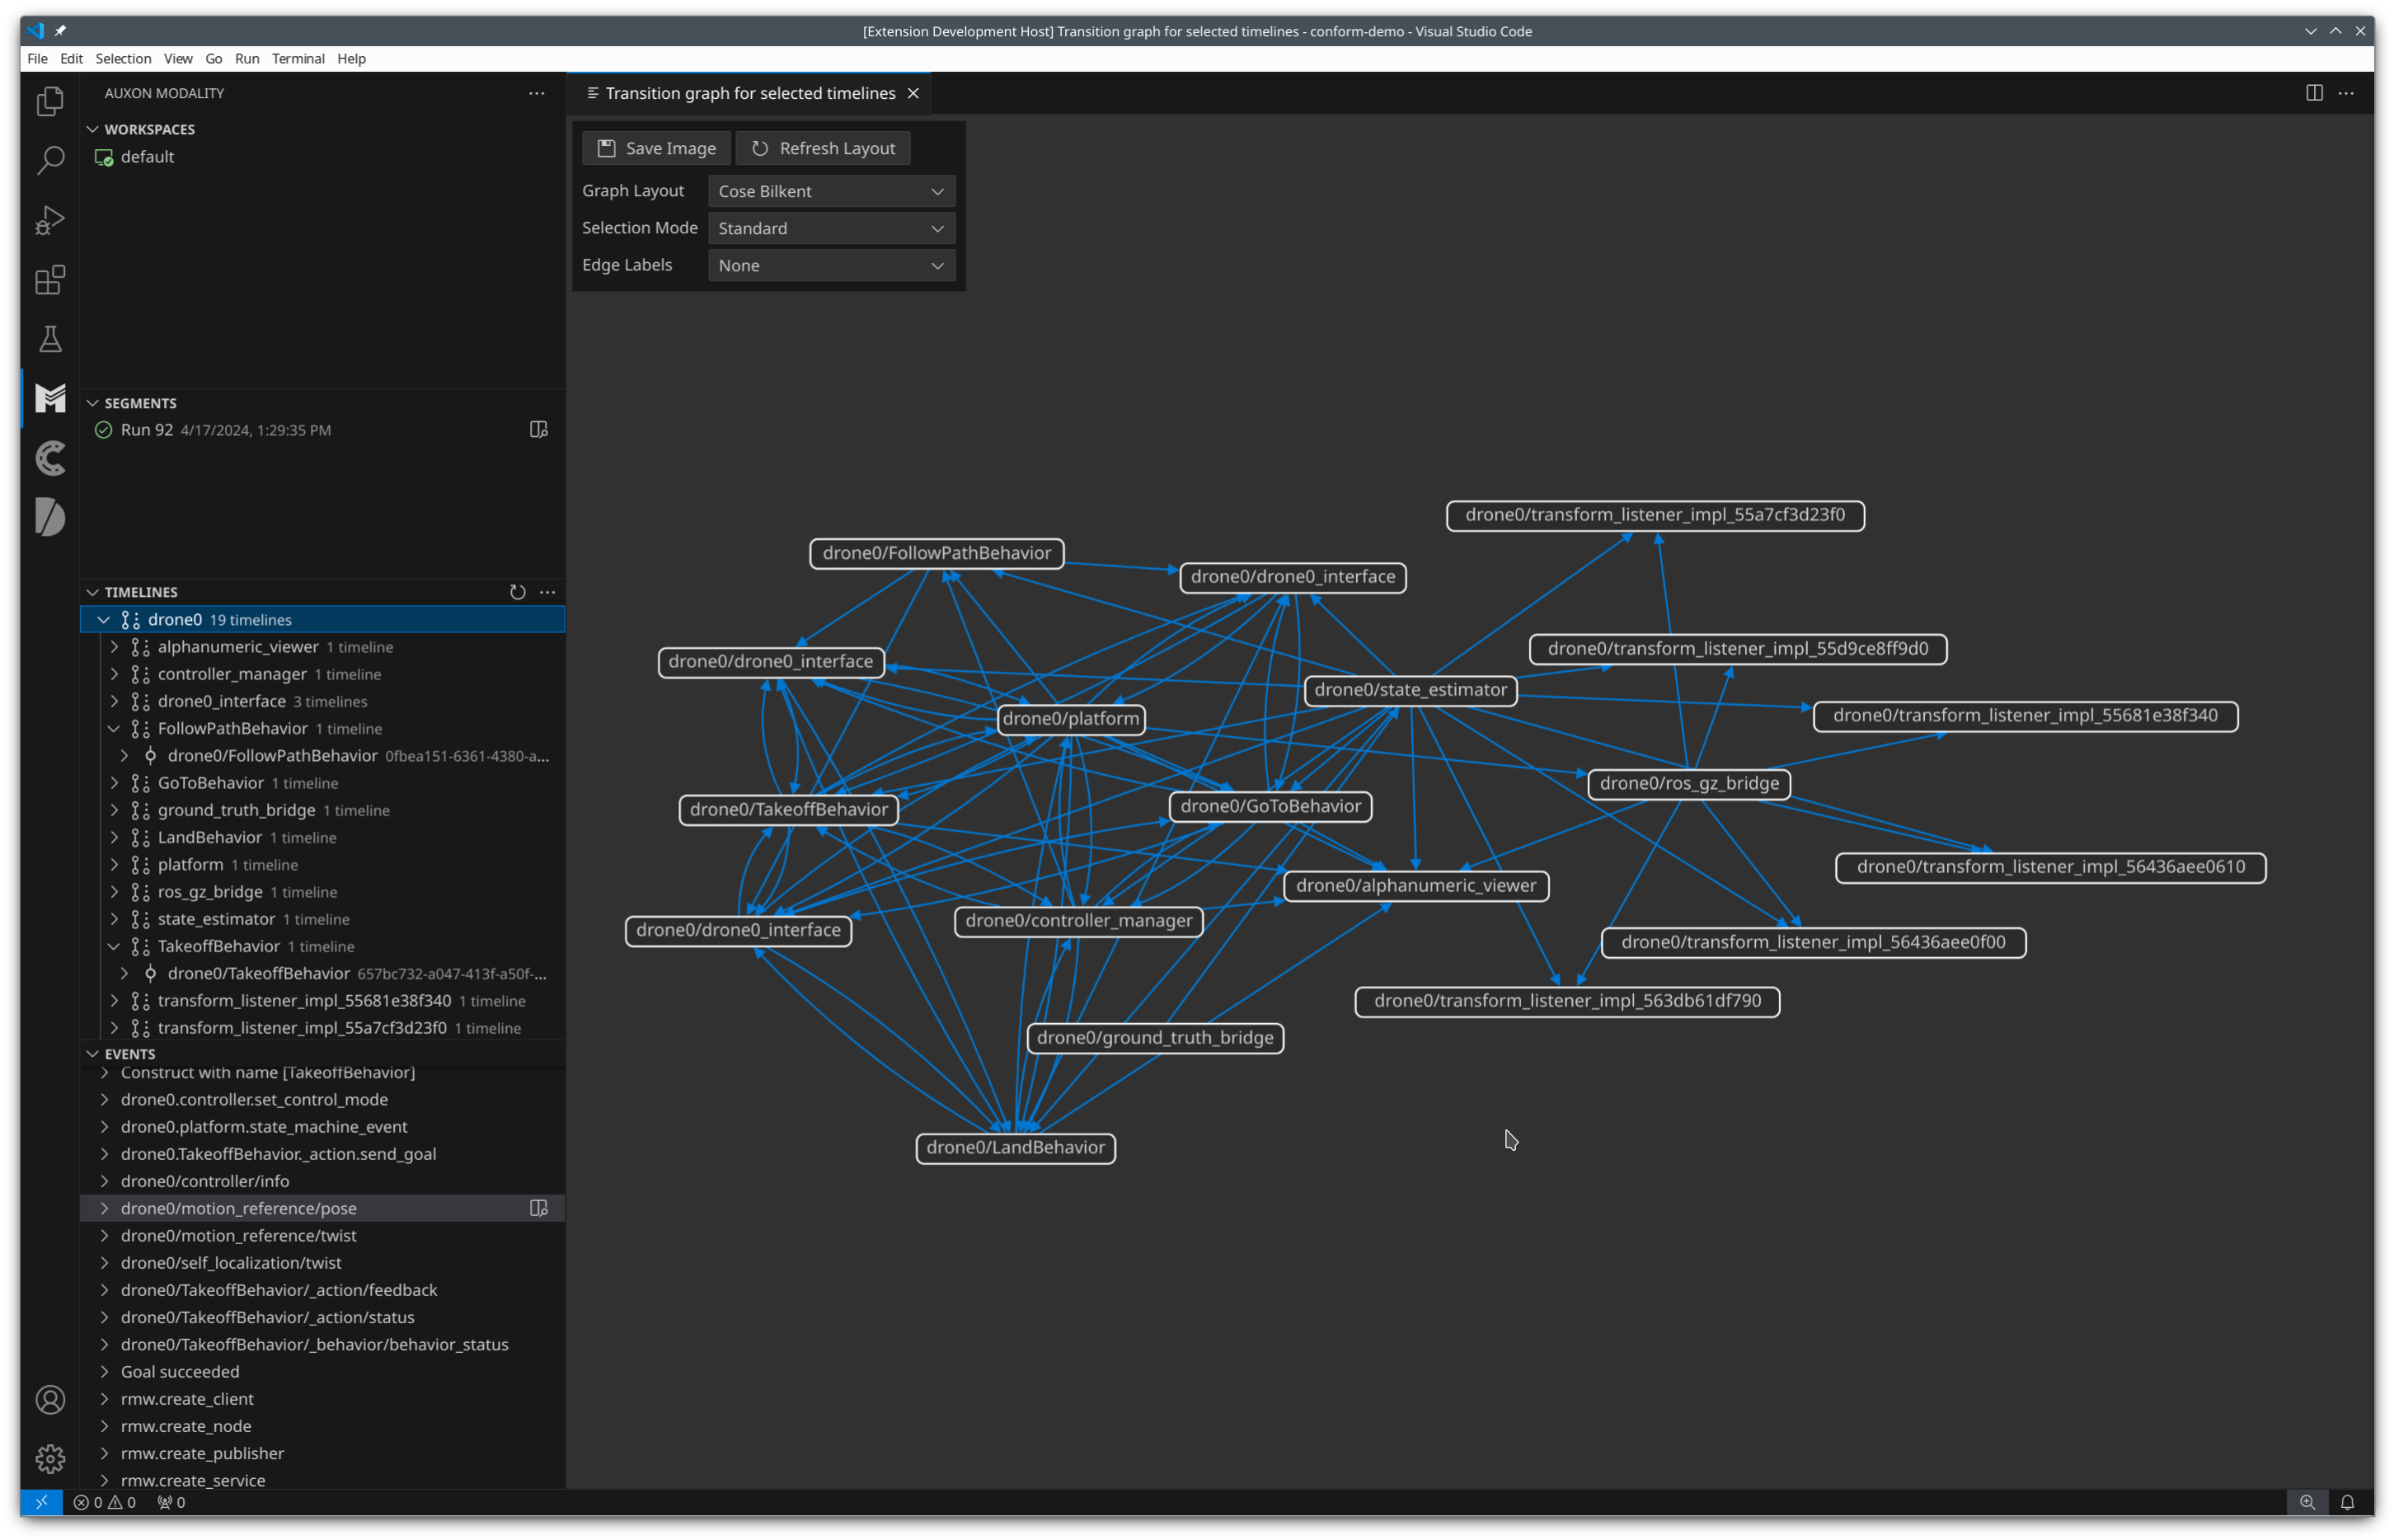 Interactions between ROS nodes in one of the drones
# 5. Cleaner metadata management
When you store timelines Modality, they are sorted into segments for analysis. Most operations use a single segment, whichever one is currently active. Some others let you run some analysis against many segments and compare their output.
By default, Modality comes with a single segmentation method that uses
the attribute timeline.run_id to sort timelines into segments. The
ROS2 probe sets this to a random UUID for each process. It can by
changed by setting the MODALITY_RUN_ID environment variable. You may
want to do this if you have multiple processes working together, that
you would like to be in the same segment. You may also want to set it
to something other that a UUID, like a serial number. Let's do that
here.
Add these lines to the top of run.sh:
if [ ! -f run_id ]; then
    echo 0 > run_id
fi

run_id=$(cat run_id)
run_id=$((${run_id}+1))
echo ${run_id} > run_id
Then, add this line to the docker invocation:
-e MODALITY_RUN_ID=${run_id} \
Then run it a few more times, and list the segments to see the data you've collected:
modality segment list
# Where to go from here
Now that you have your robot hooked up to Modality, you should peruse the documentation at https://docs.auxon.io/ (opens new window) to learn about what you can do with Modality and Conform.
Whether you're a robotics researcher, developer, or engineer, Modality and the ROS2 probe can help you streamline your development process. By providing a comprehensive view of your system's behavior and enabling data-driven analysis, Modality empowers you to build more reliable, performant, and safe ROS2 systems.
But you don't have take my word for it 🌈 (opens new window). You can trial Modality (opens new window) for your next ROS2 project and see how it works for you. And if you have any questions or feedback, don't hesitate to reach out – we're eager to hear from the ROS2 community and learn how we can make this integration even better.